Loading...
100+
Metrics Tracked
Comprehensive coverage
Real-time
Updates
Live data sync
95%
Forecast Accuracy
Reliable predictions
2.5x
Productivity Gain
Average improvement
The Reality
If you can't measure it, you're guessing.
Three locations. Three different teams. Three different spreadsheets. By the time month-end reports arrive, the data is already two weeks stale. Nursery Analytics unifies every batch, sale, and movement into one live dashboard — so you act on what's true today, not what was true last quarter.
Simple Process
How It Works
From data to insights in four automated steps
1
Data Integration
Automatically collect data from all your systems
2
AI Processing
Machine learning analyzes patterns and trends
3
Insights & Alerts
Get actionable insights and recommendations
4
Optimize & Grow
Implement data-driven improvements
Powerful Features
Complete Business Intelligence Platform
Everything you need to understand and optimize your nursery operations
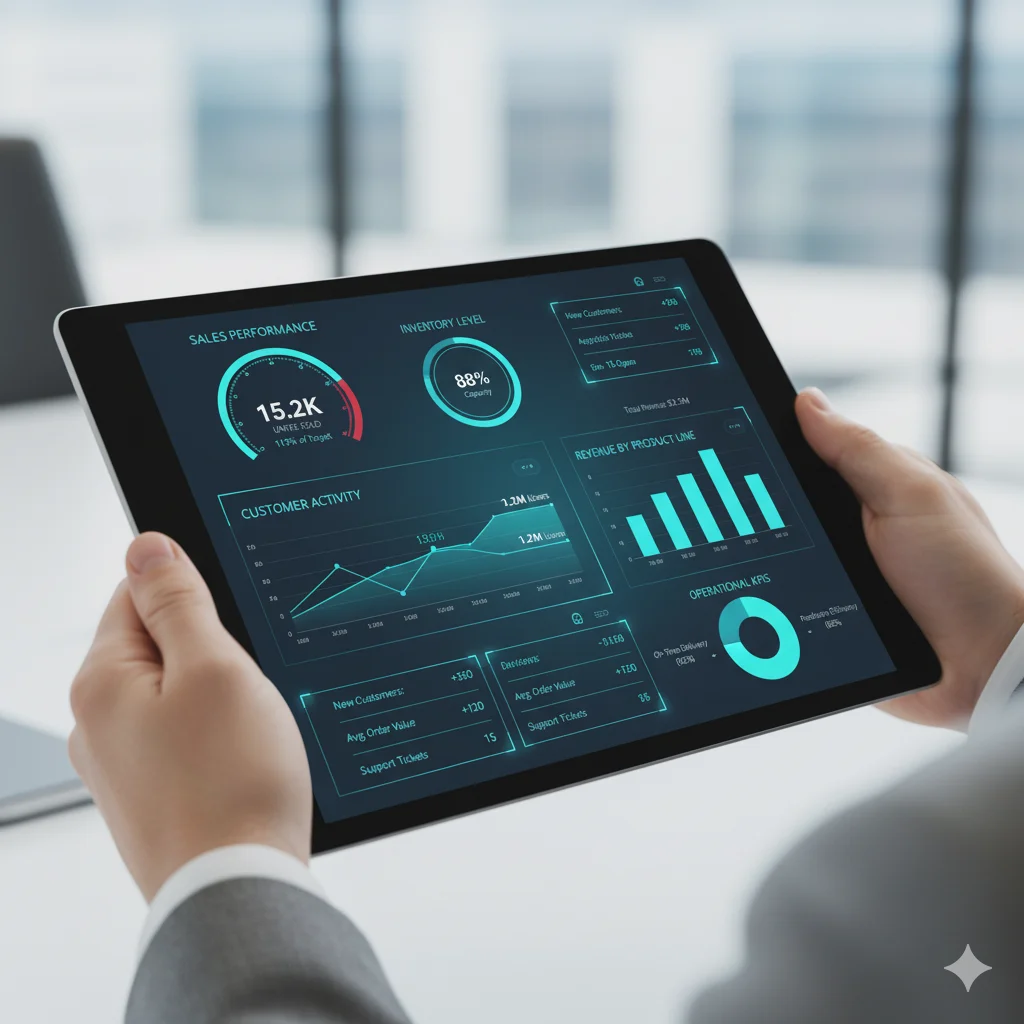
Real-time Performance Metrics
Track critical KPIs in real-time including sales performance, inventory turnover, customer satisfaction, and operational efficiency with interactive dashboards.
- Live KPI tracking
- Custom metric creation
- Performance alerts
- Historical comparisons
Predictive Sales Analytics
Use AI-powered predictive models to forecast sales trends, identify bestselling varieties, and spot emerging opportunities before your competition.
- Sales forecasting
- Revenue projections
- Product performance analysis
- Seasonal trend prediction
Customer Insights & Retention
Analyze customer behavior, purchase patterns, and lifetime value. Get AI recommendations on retention strategies and identify customers at risk of churning.
- Customer segmentation
- Lifetime value calculation
- Churn prediction
- Retention recommendations
Inventory Optimization
Optimize inventory levels with AI-driven recommendations. Reduce waste from overstocking while preventing stockouts of popular varieties.
- Stock level optimization
- Reorder point recommendations
- Waste reduction insights
- Turnover rate analysis
Seasonal Trend Analysis
Identify seasonal trends and patterns across years to optimize production planning, staffing, and marketing campaigns for maximum impact.
- Multi-year trend analysis
- Season comparison
- Peak period identification
- Demand pattern recognition
Custom Dashboards & Reports
Build custom dashboards tailored to your specific needs. Generate automated reports and share insights with your team or stakeholders.
- Drag-and-drop dashboard builder
- Automated report generation
- Team collaboration tools
- Export to multiple formats
Analytics Coverage
Comprehensive Business Analytics
Track every aspect of your nursery operations
Sales Performance
Track sales by variety, customer, region, and time period. Identify top performers and underperforming products.
Revenue trends
Sales by variety
Regional performance
Sales rep analytics
Operational Efficiency
Monitor production efficiency, resource utilization, and identify bottlenecks in your operations.
Production cycle times
Resource utilization
Waste metrics
Staff productivity
Financial Health
Get a complete picture of your financial performance with profitability analysis, cash flow tracking, and cost optimization.
Profit margins
Cash flow analysis
Cost per unit
ROI tracking
Why Choose Hortiprise
Drive growth with data-driven decisions
See measurable results with comprehensive business analytics
360° view
Better Visibility
Complete visibility into all aspects of your nursery operations
30% profit boost
Increase Profitability
Optimize pricing, reduce waste, and maximize revenue
5x faster
Faster Decisions
Make informed decisions in minutes instead of days
FAQ
Frequently Asked Questions
Find answers to common questions about Hortiprise
What metrics can I track with Nursery Analytics?
You can track over 100+ metrics including sales performance, inventory turnover, customer behavior, profit margins, production efficiency, employee productivity, and more. You can also create custom metrics specific to your business needs.
How does the AI generate insights?
Our AI analyzes your historical data, identifies patterns and trends, compares performance across time periods, and uses machine learning models to generate predictions and recommendations. The system learns from your data to provide increasingly accurate insights over time.
Can I create custom dashboards?
Yes! Our drag-and-drop dashboard builder lets you create custom views with the exact metrics you need. You can save multiple dashboards for different purposes (daily operations, executive overview, sales performance, etc.) and share them with your team.
How often is the data updated?
Data is synced in real-time from your operational systems. You'll always see the most current information on your dashboards. Historical data is preserved for trend analysis and year-over-year comparisons.
What kind of alerts can I set up?
You can set alerts for any metric or combination of metrics. Common alerts include low inventory warnings, sales targets achieved, unusual spending patterns, customer churn indicators, and production delays. Alerts can be delivered via email, SMS, or in-app notifications.
Do I need technical skills to use it?
No technical skills required! The interface is designed for business users with intuitive visualizations, simple filtering, and natural language insights. However, advanced users can access raw data exports and API integrations if needed.